El Niño is no longer just a buzzword for erratic weather. The current cycle has shifted global temperature patterns, disrupted agricultural cycles, and forced a rethink of climate preparedness. While the term describes a complex oceanic-atmospheric phenomenon, three specific metrics reveal exactly how it rearranges the planet’s climate.
1. The Sea Surface Temperature Anomaly
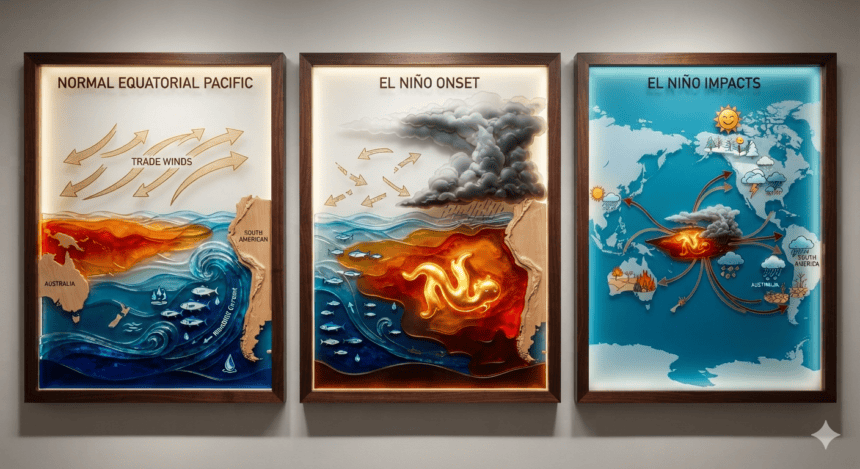
The primary indicator of El Niño sits in the central and eastern tropical Pacific. When temperatures in the Niño 3.4 region climb more than 0.5°C above the long-term average, the system shifts.
Current satellite data shows persistent, anomalous warming across this stretch of the Pacific. This isn’t just a minor fluctuation; it’s a massive transfer of heat from the ocean to the atmosphere. This thermal shift acts as a global engine, altering the jet stream’s path and dictating where storms land and where droughts take hold.
2. The Southern Oscillation Index (SOI)
Atmospheric pressure changes tell the other half of the story. The Southern Oscillation Index measures the pressure difference between Tahiti and Darwin, Australia. During an El Niño event, this index drops into negative territory.
High pressure over the western Pacific and lower pressure over the central and eastern Pacific creates a feedback loop that weakens the trade winds. When these winds falter, they fail to push warm surface water toward Asia and Australia, locking the heat in place. The result? Record-breaking dryness in the western Pacific and deluge-level rainfall in parts of South America.
3. Global Mean Temperature Departures
El Niño acts as a force multiplier for global warming. When the tropical Pacific releases its stored heat, the global average temperature spikes.
Historical data shows a clear correlation: peak El Niño years almost always rank among the hottest on record. Scientists monitor these departures closely because they provide a preview of what a warmer world looks like. Each spike in the global mean temperature chart serves as a stark reminder that while El Niño is a natural cycle, it is now playing out against a backdrop of human-induced climate change.
The Bottom Line
These charts are not merely academic tools; they are early-warning systems. From the price of coffee and cocoa to the intensity of monsoon seasons, the data points to a reality that is increasingly difficult to ignore.
“We aren’t just looking at warm water,” says one climate modeler familiar with the latest NOAA data. “We are looking at a fundamental disruption of the systems that govern our food and water security.”
As the current cycle stabilizes, the focus shifts from tracking the phenomenon to managing the fallout—a task that remains as unpredictable as the weather itself.